Most stock market for beginner guides present the basics correctly but skip the specific reasoning that separates investors who stay calm through downturns from those who panic-sell at exactly the wrong moment. After reviewing the patterns of both successful long-term investors and those who abandoned their strategies during downturns, one distinction stood out consistently: the investors who stayed the course weren’t necessarily more knowledgeable — they simply understood why the data supported staying invested, not just that it did. This guide fills those gaps with historical data and the mechanics behind why time horizon matters more than almost any other single factor.
What the Stock Market Actually Is, Beyond the Definition
When you buy a share, you become a legal part-owner of that specific business, entitled to a proportional claim on its future profits and assets. Share prices move based on real-time supply and demand — but what drives that supply and demand isn’t random; it reflects the collective, constantly-updating expectations of millions of investors about each company’s future earnings potential, not just its current performance.
Why this distinction matters practically: a company can report strong current profits and still see its stock price fall, if investors collectively expect future growth to slow. Understanding that prices reflect expectations, not just present-day results, helps explain price movements that otherwise seem confusing to beginners.
Key Terms, With the Practical Implication of Each
Bull market vs. bear market: beyond the simple definitions (rising vs. falling prices), the practical implication is behavioral — bull markets tend to attract overconfidence and risk-taking as gains feel “normal,” while bear markets trigger fear-driven selling exactly when assets are cheapest. Recognizing which phase you’re in helps you consciously counteract the natural emotional pull in each direction.
Index: understanding that an index like the S&P 500 represents a weighted basket of the 500 largest US companies (not an equal slice of each) matters because the largest companies within it have disproportionate influence on its overall movement — a detail relevant when evaluating fund options built around it.
How to Start Investing: The Reasoning Behind Each Step
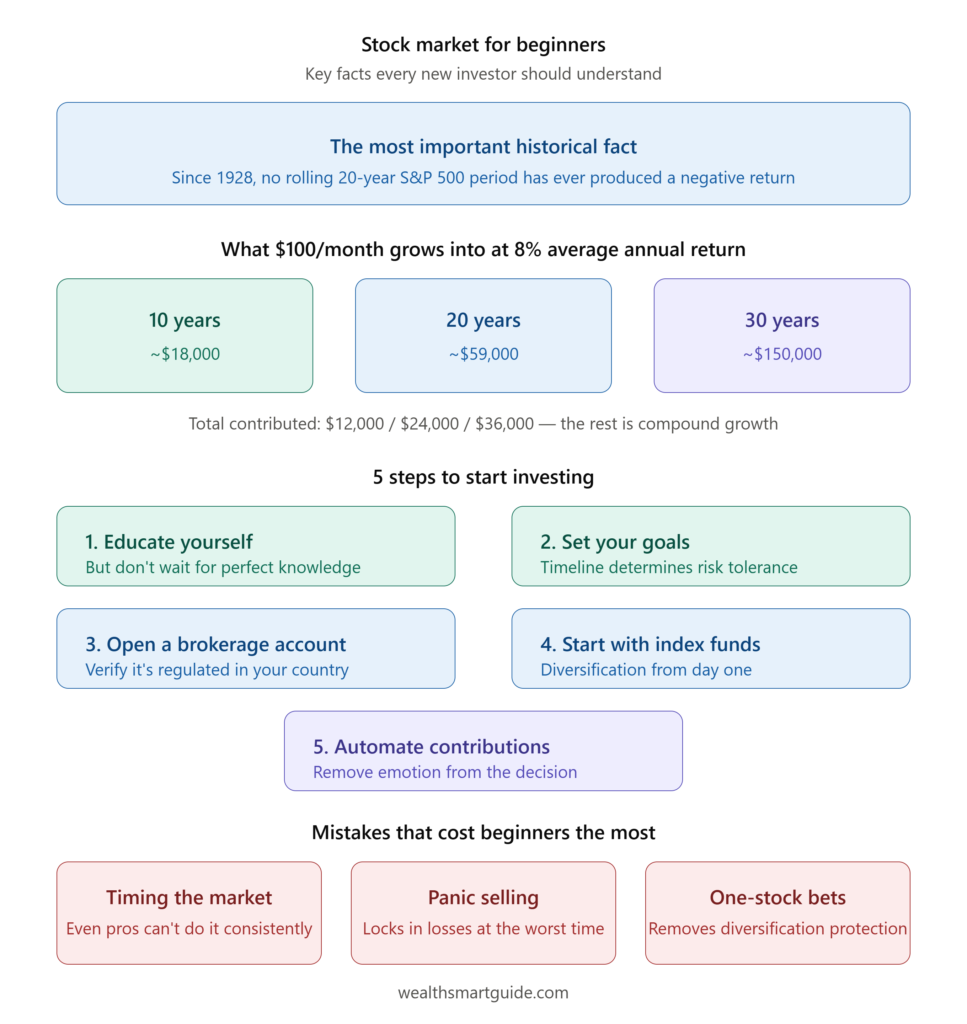
Step 1: Educate yourself, but recognize when this becomes procrastination. Basic literacy in how markets work is valuable, but waiting for complete confidence before starting is itself a costly mistake — the research on long-term historical performance suggests that time invested matters more than perfect timing or complete knowledge before beginning.
Step 2: Set your goals, because your timeline directly determines your risk tolerance. Money needed in 5 years for a house down payment shouldn’t be exposed to the same volatility as money invested for retirement 30 years away, because a short timeline doesn’t allow enough time to recover from a poorly-timed downturn, while a long timeline statistically does.
Step 3: Open a brokerage account with a platform genuinely available and regulated in your country, verified directly rather than assumed from general popularity.
Step 4: Start with broad index funds or ETFs rather than individual stocks, because broad diversification protects against the risk of any single company underperforming. For a detailed breakdown of how ETFs work and what $200 a month can actually grow into, see ETFs for Beginners: A Complete Guide to How They Work.
Step 5: Automate contributions regardless of market conditions. This directly implements dollar-cost averaging, removing the emotional guesswork of deciding whether “now” is a good time to invest — a decision that even professionals consistently struggle to make correctly.
The Power of Long-Term Investing — The Data That Actually Proves It
Here’s a fact worth understanding precisely, not just repeating: since 1928, no rolling 20-year period in S&P 500 history has ever produced a negative total return, including dividends reinvested. This holds true even for the worst possible starting points — investing right before the 1929 crash, or right before the 2000 dot-com peak — both still produced positive returns 20 years later.
For the full historical S&P 500 return data, see Investopedia’s S&P 500 historical returns.
The nuance this fact requires, for full accuracy: this doesn’t mean every 20-year period performed equally well. The worst 20-year period in history (1929–1948) delivered only about 0.6% annual returns — barely positive, and likely below inflation in real terms during parts of that stretch. The best 20-year periods delivered well above 10% annually. The guarantee isn’t of strong returns — it’s specifically that the outcome has never been negative over that time horizon, a meaningfully different and more precise claim.
Why 10-year periods don’t offer the same guarantee: rolling 10-year periods have occasionally produced negative returns historically (notably the decade ending around 2008–2009). This is precisely why a 5–10 year investing horizon requires more caution and conservative allocation than a 20+ year horizon.
Common Beginner Mistakes — Why Each One Specifically Backfires
Trying to time the market: given that even professional fund managers with full-time research teams struggle to consistently time market entries and exits correctly, a beginner attempting this faces the same fundamentally unpredictable short-term price movements with less information and more emotional attachment to the outcome.
Panic selling during downturns: given the 20-year data above, a downturn within a long-term investing horizon is a normal, expected, and historically fully-recoverable event — not a signal that something has gone uniquely wrong requiring an exit.
Following hot tips from social media: these tips typically lack the risk context, diversification reasoning, and personal timeline alignment that should inform any individual investment decision.
Putting all money in one stock: this specifically removes the diversification protection that broad market investing provides — a single company’s failure can eliminate a concentrated position entirely, while the same failure barely dents a properly diversified portfolio.
How to Handle Market Crashes — What the Historical Pattern Actually Shows
Every market crash in S&P 500 history has eventually been followed by a recovery, and every 20-year holding period on record has ended positive despite these crashes occurring within it. This isn’t a promise about the future, but it’s the strongest available historical evidence for staying invested through downturns rather than exiting.
Why buying more during a downturn can specifically help: lower prices during a crash mean your regular contributions purchase more shares for the same dollar amount — when the eventual recovery occurs, those additional shares purchased at depressed prices participate fully in that recovery, meaningfully boosting long-term returns for investors who continued contributions during the downturn rather than pausing them.
Understanding how the stock market works is the foundation, but actually getting started with a small, consistent amount is the practical next step. For a specific action plan, see How to Start Investing with $100: A Beginner’s Guide — it covers exactly how to implement the principles in this guide with a concrete starting amount.
Frequently Asked Questions About the Stock Market for Beginners
How much money do I need to start investing in the stock market? Most modern brokerage platforms allow you to start with very small amounts — some with no minimum at all — particularly through fractional shares or broad ETFs. The more important question isn’t “how much” but “how consistently”: regular contributions over time matter far more than starting with a large lump sum.
Is the stock market safe for beginners? For stock market for beginners investors, “Safe” depends entirely on your time horizon. For money you won’t need for 20+ years, the historical record shows no 20-year period has ever produced a negative return in the S&P 500 since 1928 — a meaningful data point. For money needed within 5 years, the stock market carries real short-term risk and isn’t appropriate for that portion of savings.
What’s the difference between investing in stocks and investing in index funds? Individual stocks concentrate your risk in one company’s performance — if that company struggles, your investment does too. Index funds spread your money across hundreds or thousands of companies, so no single company’s failure significantly damages your overall portfolio. For beginners without deep company-research expertise, index funds specifically remove a risk they’re poorly positioned to evaluate.
How do I know when to sell a stock? The most reliable signal isn’t price movement — it’s a change in your underlying reason for holding it. If you bought a diversified index fund for long-term retirement savings, a price drop isn’t a reason to sell; it’s a normal, historically recoverable event. If you bought an individual stock based on specific business fundamentals that have now changed materially, that’s a more legitimate reason to reconsider.
Conclusion: what stock market for beginners actually need to know behavior
The stock market rewards patience and diversification specifically, not bravery or clever timing. The historical fact that no 20-year period has ever produced a negative return provides genuine, data-backed reassurance for long-term stock market investors — but this specifically applies to sufficiently long time horizons, not to money you might need within the next few years. Start with broad, diversified funds, automate your contributions, and treat market downturns as a normal, historically recoverable part of a strategy that has, over every sufficiently long period in recorded history, rewarded those who stayed invested.